
index.md 36 KB
localeCode: zh-CN order: 68 category: 展示类 title: Data Visualization 数据可视化 icon: doc-vchart dir: column
brief: 开箱即用的多端图表库。
对于数据可视化场景,我们推荐使用 VChart。VChart 是字节跳动开源可视化解决方案 VisActor 的核心图表组件库,支持多种图表,简单易用,功能强大。
基于 VChart,我们定制了一套符合 Semi 风格的图表库,优势如下:
- 🧩 开箱即用:简单配置及初始化即可使用
- 🎨 风格统一:基于 VChart 定制了符合 Semi 风格的图表库样式,直接和 Semi Design Token 挂钩;默认样式经过多方验证,可读性和精确性高;支持用户自定义图表样式
- 🌗 响应式:支持监听页面上的亮暗模式变化,自动对页面上的 VChart 图表进行热更新,同步换肤
安装和使用
1、安装
在 React 工程中,可以使用以下命令安装 @visactor/react-vchart:
# npm
npm i @visactor/react-vchart

# yarn
yarn add @visactor/react-vchart
此外,还需安装 @visactor/vchart-semi-theme 来适配 Semi 默认主题或通过 Semi DSM 发布的自定义主题。
# npm
npm i @visactor/vchart-semi-theme

# yarn
yarn add @visactor/vchart-semi-theme
2、使用
Semi 自 v2.47.0 版本增加相关的 Design Token 用于实现 VChart 对 Semi 主题或通过 Semi DSM 发布的自定义主题的适配。因此对于 v2.47.0 及以上版本,只需要在全局执行一次 initVChartSemiTheme 方法进行初始化。该语句通常可以放在 React 项目的入口文件中。如:
//index.jsx
import React from 'react';
import { createRoot } from 'react-dom/client';
import App from './app.jsx';
import { initVChartSemiTheme } from '@visactor/vchart-semi-theme';

// initialization
initVChartSemiTheme();

const dom = document.querySelector('#root');
const root = createRoot(dom);
root.render(<App />);
initVChartSemiTheme 方法支持传入一个对象作为 option,其类型声明为:
interface IInitVChartSemiThemeOption {
  /** 初始亮暗色模式 */
  defaultMode?: 'light' | 'dark';
}
对于 v2.47.0 以下版本的 Semi,虽然没有相应的 Design Token,但是可以借助 @visactor/vchart-semi-theme 中的内置主题包样式默认值。注意:此使用方式不支持明暗模式自动切换,用户可按需设置当前图表模式,代码示例如下:
import semiDesignLight from '@visactor/vchart-semi-theme/public/semiDesignLight.json';
import semiDesignDark from '@visactor/vchart-semi-theme/public/semiDesignDark.json';
import VChart from '@visactor/vchart';
// register the theme
VChart.ThemeManager.registerTheme('semiDesignLight', semiDesignLight);
VChart.ThemeManager.registerTheme('semiDesignDark', semiDesignDark);
// apply the light theme
VChart.ThemeManager.setCurrentTheme('semiDesignLight');
// apply the dark theme
VChart.ThemeManager.setCurrentTheme('semiDesignDark');
主题包的更多信息见 @visactor/vchart-semi-theme
绘制图表以及更详细的指引详见 VChart 教程文档。
常用图表类型示例
VChart 基于可视化语法库 VGrammar 和渲染引擎 VRender 进行封装,在满足数据呈现的同时,还支持面向叙事场景的动画编排、丰富的交互能力和定制化的图表风格,简单易用的配置大大降低了用户的学习成本。
VChart 支持多种不同的图表类型,包括组合图、折线图、面积图、柱状图/条形图、饼/环图、散点图、色块图、直方图、箱形图、瀑布图、进度条、漏斗图、时序图、区间柱图、区间面积图、词云、仪表盘、矩形树图、桑基图、玫瑰图、雷达图、地图、Circle Packing、旭日图等,图表示例详情见 VChart 图表示例。以下是基于 Semi Design 默认主题的 VChart 常用图表使用示例:
柱状图
基础柱状图
import React, { useState, useCallback } from "react";
import { VChart } from "@visactor/react-vchart";
import { Radio, RadioGroup } from '@douyinfe/semi-ui';
import { initVChartSemiTheme } from '@visactor/vchart-semi-theme';

initVChartSemiTheme();

const commonSpec = {
  type: 'bar',
  data: [
    {
      id: 'barData',
      values: [
        { type:'Date', month: 'Monday', sales: 22 },
        { type:'Date', month: 'Tuesday', sales: 13 },
        { type:'Date', month: 'Wednesday', sales: 25 },
        { type:'Date', month: 'Thursday', sales: 29 },
        { type:'Date', month: 'Friday', sales: 38 }
      ]
    }
  ],
  title: {
    visible: true,
    text: 'Bar chart',
    subtext: 'This is a bar chart',
  },
  legends: {
    visible: true,
  },
  xField: 'month',
  yField: 'sales',
  seriesField: 'type',
};

function App() {
  const [direction, setDirection] = useState("vertical");
  const onChange = useCallback((e) => setDirection(e.target.value), []);
  const spec = useMemo(() => {
    const isVertical = direction === 'vertical';
    return {
      ...commonSpec,
      xField: isVertical ? 'month' : 'sales',
      yField: isVertical ? 'sales' : 'month',
      direction: direction,
    };
  }, [direction]);
  return (
    <>
     <RadioGroup onChange={onChange} value={direction} >
        <Radio value={'vertical'}>vertical</Radio>
        <Radio value={'horizontal'}>horizontal</Radio>
      </RadioGroup>
      <div style={{ height: 440 }}>
        <VChart
          key={direction}
          spec={spec}
          option={{ mode: "desktop-browser" }}
        />
      </div>
    </>
  )
}

render(App);
分组柱状图
import React, { useState, useCallback } from "react";
import { VChart } from "@visactor/react-vchart";
import { Radio, RadioGroup } from '@douyinfe/semi-ui';

const commonSpec = {
  type: 'bar',
  data: [
    {
      id: 'barData',
      values: [
        { type: 'Autocracies', year: '1930', value: 129 },
        { type: 'Autocracies', year: '1940', value: 133 },
        { type: 'Autocracies', year: '1950', value: 130 },
        { type: 'Autocracies', year: '1960', value: 126 },
        { type: 'Autocracies', year: '1970', value: 117 },
        { type: 'Autocracies', year: '1980', value: 114 },
        { type: 'Autocracies', year: '1990', value: 111 },
        { type: 'Autocracies', year: '2000', value: 89 },
        { type: 'Autocracies', year: '2010', value: 80 },
        { type: 'Autocracies', year: '2018', value: 80 },
        { type: 'Democracies', year: '1930', value: 22 },
        { type: 'Democracies', year: '1940', value: 13 },
        { type: 'Democracies', year: '1950', value: 25 },
        { type: 'Democracies', year: '1960', value: 29 },
        { type: 'Democracies', year: '1970', value: 38 },
        { type: 'Democracies', year: '1980', value: 41 },
        { type: 'Democracies', year: '1990', value: 57 },
        { type: 'Democracies', year: '2000', value: 87 },
        { type: 'Democracies', year: '2010', value: 98 },
        { type: 'Democracies', year: '2018', value: 99 }
      ]
    }
  ],
  seriesField: 'type',
  title: {
    visible: true,
    text: 'Grouped bar chart',
    subtext: 'This is a grouped bar chart',
  },
  legends: {
    visible: true,
  }
};

function App() {
  const [direction, setDirection] = useState("vertical");
  const onChange = useCallback((e) => setDirection(e.target.value), []);
  const spec = useMemo(() => {
    const isVertical = direction === 'vertical';
    return {
      ...commonSpec,
      xField: isVertical ? ['year', 'type'] : 'value',
      yField: isVertical ? 'value' : ['year', 'type'],
      direction: direction,
    };
  }, [direction]);
  return (
    <>
     <RadioGroup onChange={onChange} value={direction} >
        <Radio value={'vertical'}>vertical</Radio>
        <Radio value={'horizontal'}>horizontal</Radio>
      </RadioGroup>
      <div style={{ height: 440 }}>
        <VChart
            key={direction}
            spec={spec}
            option={{ mode: "desktop-browser" }}
        />
      </div>
    </>
  )
}

render(App);
堆叠柱状图
import React, { useState, useCallback } from "react";
import { VChart } from "@visactor/react-vchart";
import { Radio, RadioGroup } from '@douyinfe/semi-ui';

const commonSpec = {
  type: 'bar',
  stack: true,
  data: [
    {
      id: 'barData',
      values: [
        { State: 'WY', Age: 'Under 5 Years', Population: 25635 },
        { State: 'WY', Age: '5 to 13 Years', Population: 1890 },
        { State: 'WY', Age: '14 to 17 Years', Population: 9314 },
        { State: 'DC', Age: 'Under 5 Years', Population: 30352 },
        { State: 'DC', Age: '5 to 13 Years', Population: 20439 },
        { State: 'DC', Age: '14 to 17 Years', Population: 10225 },
        { State: 'VT', Age: 'Under 5 Years', Population: 38253 },
        { State: 'VT', Age: '5 to 13 Years', Population: 42538 },
        { State: 'VT', Age: '14 to 17 Years', Population: 15757 },
        { State: 'ND', Age: 'Under 5 Years', Population: 51896 },
        { State: 'ND', Age: '5 to 13 Years', Population: 67358 },
        { State: 'ND', Age: '14 to 17 Years', Population: 18794 },
        { State: 'AK', Age: 'Under 5 Years', Population: 72083 },
        { State: 'AK', Age: '5 to 13 Years', Population: 85640},
        { State: 'AK', Age: '14 to 17 Years', Population: 22153 }
      ]
    }
  ],
  title: {
    visible: true,
    text: 'Stacked bar chart',
    subtext: 'This is a stacked bar chart',
  },
  seriesField: 'Age',
  legends: {
    visible: true
  },
};

function App() {
  const [direction, setDirection] = useState("vertical");
  const onChange = useCallback((e) => setDirection(e.target.value), []);
  const spec = useMemo(() => {
    const isVertical = direction === 'vertical';
    return {
      ...commonSpec,
      xField: isVertical ? 'State' : 'Population',
      yField: isVertical ? 'Population' : 'State',
      direction: direction,
    };
  }, [direction]);
  return (
    <>
     <RadioGroup onChange={onChange} value={direction} >
        <Radio value={'vertical'}>vertical</Radio>
        <Radio value={'horizontal'}>horizontal</Radio>
      </RadioGroup>
      <div style={{ height: 440 }}>
        <VChart
            key={direction}
            spec={spec}
            option={{ mode: "desktop-browser" }}
        />
      </div>
    </>
  )
}

render(App);
百分比堆叠柱状图
import React, { useState, useCallback } from "react";
import { VChart } from "@visactor/react-vchart";
import { Radio, RadioGroup } from '@douyinfe/semi-ui';

const commonSpec = {
  type: 'bar',
  percent: true,
  stack: true,
  data: [
    {
      id: 'barData',
      values: [
        { State: 'WY', Age: 'Under 5 Years', Population: 25635 },
        { State: 'WY', Age: '5 to 13 Years', Population: 1890 },
        { State: 'WY', Age: '14 to 17 Years', Population: 9314 },
        { State: 'DC', Age: 'Under 5 Years', Population: 30352 },
        { State: 'DC', Age: '5 to 13 Years', Population: 20439 },
        { State: 'DC', Age: '14 to 17 Years', Population: 10225 },
        { State: 'VT', Age: 'Under 5 Years', Population: 38253 },
        { State: 'VT', Age: '5 to 13 Years', Population: 42538 },
        { State: 'VT', Age: '14 to 17 Years', Population: 15757 },
        { State: 'ND', Age: 'Under 5 Years', Population: 51896 },
        { State: 'ND', Age: '5 to 13 Years', Population: 67358 },
        { State: 'ND', Age: '14 to 17 Years', Population: 18794 },
        { State: 'AK', Age: 'Under 5 Years', Population: 72083 },
        { State: 'AK', Age: '5 to 13 Years', Population: 85640},
        { State: 'AK', Age: '14 to 17 Years', Population: 22153 }
      ]
    }
  ],
  title: {
    visible: true,
    text: 'Percentage stacked bar chart',
    subtext: 'This is a percentage stacked bar chart',
  },
  seriesField: 'Age',
  legends: { visible: true },
  axes: [
    {
      orient: 'left',
      label: {
        formatMethod: val => {
          return `${(val * 100).toFixed(2)}%`;
        }
      }
    }
  ],
};

function App() {
  const [direction, setDirection] = useState("vertical");
  const onChange = useCallback((e) => setDirection(e.target.value), []);
  const spec = useMemo(() => {
    const isVertical = direction === 'vertical';
    const spec = {
      ...commonSpec,
      xField: isVertical ? 'State' : 'Population',
      yField: isVertical ? 'Population' : 'State',
      direction: direction,
    };
    spec.axes[0].orient = isVertical ? 'left': 'top';
    return spec;
  }, [direction]);
  return (
    <>
     <RadioGroup onChange={onChange} value={direction} >
        <Radio value={'vertical'}>vertical</Radio>
        <Radio value={'horizontal'}>horizontal</Radio>
      </RadioGroup>
      <div style={{ height: 440 }}>
        <VChart
            key={direction}
            spec={spec}
            option={{ mode: "desktop-browser" }}
        />
      </div>
    </>
  )
}

render(App);
折线图
import React, { useState, useCallback } from "react";
import { VChart } from "@visactor/react-vchart";
import { Radio, RadioGroup } from '@douyinfe/semi-ui';

const commonSpec = {
  type: 'line',
  xField: 'year',
  yField: 'count',
  seriesField: 'medalType',
  legends: { visible: true }
};

const data = [[40, 32, 34, 36, 45, 33, 34, 83, 36, 37, 44, 37, 35, 36, 46],
  [19, 25, 21, 26, 28, 31, 35, 60, 31, 34, 32, 24, 40, 38, 29],
  [17, 17, 16, 28, 34, 30, 25, 30, 27, 37, 25, 33, 26, 36, 29]].map((arr, outer) => {
  const type = ['Gold', 'Silver', 'Bronze'][outer];
  return arr.map((item, inner) => ({
    year: `${inner * 4 + 1952}`,
    count: item,
    medalType: type,
  }));
});

function App() {
  const [type, setType] = useState('multiple');
  const onChange = useCallback((e) => setType(e.target.value), []);
  const spec = useMemo(() => {
    return {
      ...commonSpec,
      title: {
        visible: true,
        text: `${type === "multiple" ? "Multi-series" : "Basic"} line chart`,
        subtext: `This is a ${type === "multiple" ? "multi-series" : "basic"} line chart`,
      },
      data: { values: type === 'multiple' ? data[0].concat(data[1]).concat(data[2]) : data[0] }
    };
  }, [type])

  return (
    <>
      <RadioGroup onChange={onChange} value={type} >
        <Radio value={'multiple'}>multiple</Radio>
        <Radio value={'single'}>single</Radio>
      </RadioGroup>
      <div style={{ height: 440 }}>
        <VChart
            key={type}
            spec={spec}
            option={{ mode: "desktop-browser"}}
        />
      </div>
    </>
  )
}

render(App);
面积图
import React from "react";
import { VChart } from "@visactor/react-vchart";

const commonSpec = {
  type: 'area',
  stack: true,
  title: {
    visible: true,
    text: 'Stacked area chart',
    subtext: 'This is a stacked area chart',
  },
  xField: 'type',
  yField: 'value',
  seriesField: 'country',
  legends: { visible: true },
  tooltip: {
    dimension: {
      updateContent: data => {
        let sum = 0;
        data.forEach(datum => {
          sum += +datum.value;
        });
        data.push({
          hasShape: 'false',
          key: 'Total',
          value: sum
        });
        return data;
      }
    }
  }
};

const values = [[4229, 4376, 3054, 12814], [3932, 3987, 5067, 13012],
 [5221, 3574, 7004, 11624], [9256, 4376, 9054, 8814],[3308, 4572, 12043, 12998],
 [5432, 3417, 15067, 12321],[13701, 5231, 10119, 10342],[4008, 4572, 12043, 22998],
 [18712, 6134, 10419, 11261]].reduce((acc, arr, index) => {
  const type = ['Nail polish', 'Eyebrow pencil', 'Rouge', 'Lipstick', 'Eyeshadows',
 'Eyeliner', 'Foundation', 'Lip gloss', 'Mascara'][index];
  const result = ['Africa', 'EU', 'China', 'USA'].map((item, innerIndex) => ({
      country: item,
      type: type,
      value: arr[innerIndex],
    }));
    return acc.concat(result);
 }, []);

const data = {
  fields: {
    country: {
      domain: ['Africa', 'EU', 'China', 'USA'].reverse(),
      lockStatisticsByDomain: true
    }
  },
  values: values,
}

function App() {
  return (
    <div style={{ height: 460 }}>
      <VChart
          spec={{ ...commonSpec,  data: data }}
          option={{ mode: "desktop-browser"}}
      />
    </div>
  )
}

render(App);
饼图
import React, { useState, useCallback } from "react";
import { VChart } from "@visactor/react-vchart";
import { Radio, RadioGroup } from '@douyinfe/semi-ui';

const commonSpec = {
  type: 'pie',
  data: [
    {
      id: 'id0',
      values: [{ type: 'oxygen', value: '46.60' }, { type: 'silicon', value: '27.72' },
        { type: 'aluminum', value: '8.13' }, { type: 'iron', value: '5' },
        { type: 'calcium', value: '3.63' }, { type: 'sodium', value: '2.83' },
        { type: 'potassium', value: '2.59' }, { type: 'others', value: '3.5' }]
    }
  ],
  valueField: 'value',
  categoryField: 'type',
  label: {
    visible: true
  },
  tooltip: {
    mark: {
      content: [
        {
          key: datum => datum['type'],
          value: datum => datum['value'] + '%'
        }
      ]
    }
  }
};

const donutChart = {
  title: {
    visible: true,
    text: 'Pie chart',
    subtext: 'This is a pie chart',
  },
  legends: {
    visible: true,
    orient: 'right'
  },
}

const donutWithIndicator = {
  title: {
    visible: true,
    text: 'Donut chart with indicator',
    subtext: 'This is a donut chart with indicator',
  },
  legends: {
    visible: true,
    orient: 'right'
  },
  indicator: {
    visible: true,
    trigger: 'select',
    title: {
      visible: true,
      style: {
        fontSize: 12,
        fontWeight: 'normal',
        text: data => {
          if (data) {
            const value = data['type'];
            return value ? value : null;
          }
          return '总和';
        }
      }
    },
    content: [
      {
        visible: true,
        fontWeight: 'bold',
        style: {
          fontSize: 20,
          text: data => {
            if (data) {
              const value = data['value'];
              return value ? `${value}%` : null;
            }
            return 1234;
          }
        }
      }
    ]
  }
}

function App() {
  const [type, setType] = useState('donut');
  const onChange = useCallback((e) => setType(e.target.value), []);
  return (
    <>
      <RadioGroup onChange={onChange} value={type} >
        <Radio value={'donut'}>饼图</Radio>
        <Radio value={'donutWithIndicator'}>带指标卡饼图</Radio>
      </RadioGroup>
      <div style={{ display: 'flex', alignItem: 'center', justifyContent: 'center'}}>
        <VChart
            spec={{
                ...commonSpec,
                ...(type === 'donut' ? donutChart : donutWithIndicator),
            }}
            option={{ mode: "desktop-browser" }}
            style={{ height: 440, width:680 }}
        />
      </div>
    </>
  )
}

render(App);
雷达图
import React, { useState, useCallback } from "react";
import { VChart } from "@visactor/react-vchart";
import { Radio, RadioGroup } from '@douyinfe/semi-ui';

const basicSpec = {
  type: 'radar',
  data: [
    {
      id: 'radarData',
      values: [
        { key: 'Strength', value: 5 },
        { key: 'Speed', value: 5 },
        { key: 'Shooting', value: 3 },
        { key: 'Endurance', value: 5 },
        { key: 'Precision', value: 5 },
        { key: 'Growth', value: 5 }
      ]
    }
  ],
  categoryField: 'key',
  valueField: 'value',
  point: { visible: true },
  area: { visible: true },
  axes: [
    {
      orient: 'radius', // radius axis
      zIndex: 100,
      min: 0,
      max: 8,
      domainLine: { visible: false },
      label: {
        visible: true,
        space: 0,
        style: { textAlign: 'center', stroke: '#fff', lineWidth: 4 }
      },
      grid: { smooth: false },
    },
    {
      orient: 'angle', // angle axis
      zIndex: 50,
      tick: { visible: false },
      domainLine: { visible: false },
      label: { space: 20 },
    }
  ]
};

const groupSpec = {
  type: 'radar',
  data: [{
    values: [[45, 61, 92, 57, 46, 36, 33, 63, 57, 53, 69, 40],
            [31, 39, 81, 39, 64, 21, 58, 72, 47, 37, 80, 74],
            [90, 95, 62, 52, 74, 87, 80, 69, 74, 84, 94, 23]]
            .reduce((acc, cur, index) => {
              const type = ['A', 'B', 'C'];
              const month = ['Jan.', 'Feb.', 'Mar.', 'Apr.', 'May.', 'Jun.',
              'Jul.', 'Aug.', 'Sep.', 'Oct.', 'Nov.', 'Dec.']
              const result = cur.map((item, innerIndex) => ({
                month: month[innerIndex],
                value: item,
                type: type[index]
              }))
              return acc.concat(result);
            }, []),
  }],
  categoryField: 'month',
  valueField: 'value',
  seriesField: 'type',
  stack: true,
  area: { visible: true },
  legends: { visible: true, orient: 'right'}
}

function App() {
  const [type, setType] = useState('group');
  const onChange = useCallback((e) => setType(e.target.value), []);
  return (
    <>
      <RadioGroup onChange={onChange} value={type} >
        <Radio value={'basic'}>基础雷达图</Radio>
        <Radio value={'group'}>分组雷达图</Radio>
      </RadioGroup>
      <div style={{ height: 440 }}>
        <VChart
            spec={type === 'basic' ? basicSpec : groupSpec}
            option={{ mode: "desktop-browser" }}
        />
      </div>
    </>
  )
}

render(App);
散点图
import React from "react";
import { VChart } from "@visactor/react-vchart";

const data = [
  { continent: 'Americas', Country: 'Argentina', LifeExpectancy: 75.32, GDP: 12779.37964, Population: 40301927 },
  { continent: 'Americas', Country: 'Brazil', LifeExpectancy: 72.39, GDP: 9065.800825, Population: 190010647 },
  { continent: 'Americas', Country: 'Canada', LifeExpectancy: 80.653, GDP: 36319.23501, Population: 33390141 },
  { continent: 'Americas', Country: 'Chile', LifeExpectancy: 78.553, GDP: 13171.63885, Population: 16284741 },
  { continent: 'Americas', Country: 'Colombia', LifeExpectancy: 72.889, GDP: 7006.580419, Population: 44227550 },
  { continent: 'Americas', Country: 'Costa Rica', LifeExpectancy: 78.782, GDP: 9645.06142, Population: 4133884 },
  { continent: 'Americas', Country: 'Cuba', LifeExpectancy: 78.273, GDP: 8948.102923, Population: 11416987 },
  { continent: 'Americas', Country: 'Dominican Republic', LifeExpectancy: 72.235, GDP: 6025.374752, Population: 9319622 },
  { continent: 'Americas', Country: 'Ecuador', LifeExpectancy: 74.994, GDP: 6873.262326, Population: 13755680 },
  { continent: 'Americas', Country: 'El Salvador', LifeExpectancy: 71.878, GDP: 5728.353514, Population: 6939688 },
  { continent: 'Americas', Country: 'Guatemala', LifeExpectancy: 70.259, GDP: 5186.050003, Population: 12572928 },
  { continent: 'Americas', Country: 'Honduras', LifeExpectancy: 70.198, GDP: 3548.330846, Population: 7483763 },
  { continent: 'Americas', Country: 'Jamaica', LifeExpectancy: 72.567, GDP: 7320.880262, Population: 2780132 },
  { continent: 'Americas', Country: 'Mexico', LifeExpectancy: 76.195, GDP: 11977.57496, Population: 108700891 },
  { continent: 'Americas', Country: 'Nicaragua', LifeExpectancy: 72.899, GDP: 2749.320965, Population: 5675356 },
  { continent: 'Americas', Country: 'Panama', LifeExpectancy: 75.537, GDP: 9809.185636, Population: 3242173 },
  { continent: 'Americas', Country: 'Paraguay', LifeExpectancy: 71.752, GDP: 4172.838464, Population: 6667147 },
  { continent: 'Americas', Country: 'Peru', LifeExpectancy: 71.421, GDP: 7408.905561, Population: 28674757 },
  { continent: 'Americas', Country: 'Puerto Rico', LifeExpectancy: 78.746, GDP: 19328.70901, Population: 3942491 },
  { continent: 'Americas', Country: 'Trinidad and Tobago', LifeExpectancy: 69.819, GDP: 18008.50924, Population: 1056608 },
  { continent: 'Americas', Country: 'United States', LifeExpectancy: 78.242, GDP: 42951.65309, Population: 301139947 },
  { continent: 'Americas', Country: 'Uruguay', LifeExpectancy: 76.384, GDP: 10611.46299, Population: 3447496 },
  { continent: 'Americas', Country: 'Venezuela', LifeExpectancy: 73.747, GDP: 11415.80569, Population: 26084662 },
  { continent: 'Asia', Country: 'China', LifeExpectancy: 72.961, GDP: 4959.114854, Population: 1318683096 },
  { continent: 'Asia', Country: 'Hong Kong, China', LifeExpectancy: 82.208, GDP: 39724.97867, Population: 6980412 },
  { continent: 'Asia', Country: 'Japan', LifeExpectancy: 82.603, GDP: 31656.06806, Population: 127467972 },
  { continent: 'Asia', Country: 'Korea, Dem. Rep.', LifeExpectancy: 67.297, GDP: 1593.06548, Population: 23301725 },
  { continent: 'Asia', Country: 'Korea, Rep.', LifeExpectancy: 78.623, GDP: 23348.13973, Population: 49044790 },
  { continent: 'Europe', Country: 'Albania', LifeExpectancy: 76.423, GDP: 5937.029526, Population: 3600523 },
  { continent: 'Europe', Country: 'Austria', LifeExpectancy: 79.829, GDP: 36126.4927, Population: 8199783 },
  { continent: 'Europe', Country: 'Belgium', LifeExpectancy: 79.441, GDP: 33692.60508, Population: 10392226 },
  { continent: 'Europe', Country: 'Bosnia and Herzegovina', LifeExpectancy: 74.852, GDP: 7446.298803, Population: 4552198 },
  { continent: 'Europe', Country: 'Bulgaria', LifeExpectancy: 73.005, GDP: 10680.79282, Population: 7322858 },
  { continent: 'Europe', Country: 'Croatia', LifeExpectancy: 75.748, GDP: 14619.22272, Population: 4493312 },
  { continent: 'Europe', Country: 'Czech Republic', LifeExpectancy: 76.486, GDP: 22833.30851, Population: 10228744 },
  { continent: 'Europe', Country: 'Denmark', LifeExpectancy: 78.332, GDP: 35278.41874, Population: 5468120 },
  { continent: 'Europe', Country: 'Finland', LifeExpectancy: 79.313, GDP: 33207.0844, Population: 5238460 },
  { continent: 'Europe', Country: 'France', LifeExpectancy: 80.657, GDP: 30470.0167, Population: 61083916 },
  { continent: 'Europe', Country: 'Germany', LifeExpectancy: 79.406, GDP: 32170.37442, Population: 82400996 },
  { continent: 'Europe', Country: 'Greece', LifeExpectancy: 79.483, GDP: 27538.41188, Population: 10706290 },
  { continent: 'Europe', Country: 'Hungary', LifeExpectancy: 73.338, GDP: 18008.94444, Population: 9956108 },
  { continent: 'Europe', Country: 'Iceland', LifeExpectancy: 81.757, GDP: 36180.78919, Population: 301931 },
  { continent: 'Europe', Country: 'Ireland', LifeExpectancy: 78.885, GDP: 40675.99635, Population: 4109086 },
  { continent: 'Europe', Country: 'Italy', LifeExpectancy: 80.546, GDP: 28569.7197, Population: 58147733 },
  { continent: 'Europe', Country: 'Montenegro', LifeExpectancy: 74.543, GDP: 9253.896111, Population: 684736 },
  { continent: 'Europe', Country: 'Netherlands', LifeExpectancy: 79.762, GDP: 36797.93332, Population: 16570613 },
  { continent: 'Europe', Country: 'Norway', LifeExpectancy: 80.196, GDP: 49357.19017, Population: 4627926 },
  { continent: 'Europe', Country: 'Poland', LifeExpectancy: 75.563, GDP: 15389.92468, Population: 38518241 },
  { continent: 'Europe', Country: 'Portugal', LifeExpectancy: 78.098, GDP: 20509.64777, Population: 10642836 },
  { continent: 'Europe', Country: 'Romania', LifeExpectancy: 72.476, GDP: 10808.47561, Population: 22276056 },
  { continent: 'Europe', Country: 'Serbia', LifeExpectancy: 74.002, GDP: 9786.534714, Population: 10150265 },
  { continent: 'Europe', Country: 'Slovak Republic', LifeExpectancy: 74.663, GDP: 18678.31435, Population: 5447502 },
  { continent: 'Europe', Country: 'Slovenia', LifeExpectancy: 77.926, GDP: 25768.25759, Population: 2009245 },
  { continent: 'Europe', Country: 'Spain', LifeExpectancy: 80.941, GDP: 28821.0637, Population: 40448191 },
  { continent: 'Europe', Country: 'Sweden', LifeExpectancy: 80.884, GDP: 33859.74835, Population: 9031088 },
  { continent: 'Europe', Country: 'Switzerland', LifeExpectancy: 81.701, GDP: 37506.41907, Population: 7554661 },
  { continent: 'Europe', Country: 'Turkey', LifeExpectancy: 71.777, GDP: 8458.276384, Population: 71158647 },
  { continent: 'Europe', Country: 'United Kingdom', LifeExpectancy: 79.425, GDP: 33203.26128, Population: 60776238 },
  { continent: 'Oceania', Country: 'Australia', LifeExpectancy: 81.235, GDP: 34435.36744, Population: 20434176 },
  { continent: 'Oceania', Country: 'New Zealand', LifeExpectancy: 80.204, GDP: 25185.00911, Population: 4115771 }
];

function logScale(value, domain, range) {
  // Calculate the logarithm of the domain and range
  const logDomain = domain.map(x => (x !== 0 ? Math.log10(x) : 0));
  const logRange = range.map(x => Math.log10(x));
  // Calculate the position of the value in the domain, map it to the range
  const t = (Math.log10(value) - logDomain[0]) / (logDomain[1] - logDomain[0]);
  const newValue = (logRange[1] - logRange[0]) * t + logRange[0];
  // Return the mapped value and restore the logarithmic scaling
  return Math.pow(10, newValue);
}

// chart spec
const spec = {
  type: 'common',
  series: [
    {
      type: 'scatter',
      xField: 'GDP',
      yField: 'LifeExpectancy',
      seriesField: 'continent',
      sizeField: 'Population',
      size: d => logScale(d.Population, [0, Math.max(...data.map(d => d.Population))], [1, 20])
    }
  ],
  crosshair: {
    yField: {
      visible: true,
      line: { visible: true, type: 'line' },
      label: { visible: true }
    },
    xField: {
      visible: true,
      line: { visible: true, type: 'line' },
      label: { visible: true }
    }
  },
  data: [{ id: 'data', values: data }],
  title: {
    visible: true,
    text: 'Basic scatter chart',
    subtext: 'This is a basic scatter chart',
  },
  axes: [
    {
      orient: 'left',
      type: 'linear',
      range: {
        min: Math.min(...data.map(d => d.LifeExpectancy)),
        max: Math.max(...data.map(d => d.LifeExpectancy))
      },
      domainLine: { visible: true }
    },
    {
      orient: 'bottom',
      type: 'linear',
      domainLine: { visible: true }
    }
  ],
  legends: [{ visible: true,}]
};

function App() {
  return (
    <div style={{ height: 460 }}>
      <VChart
        spec={spec}
        option={{ mode: "desktop-browser" }}
      />
    </div>
  )
}

render(App);
设计规范
选用指南
为了帮助设计师进行图表选择,我们对常用的 11 种图表进行了深度解析,并归纳出图表选用方案,见图表选用规范。
颜色规范
@visactor/vchart-semi-theme 中定义了 20 个离散数据色板的色值。色值从已有的 Semi 色板中按照分裂互补配色和暗亮交替的原则进行排序。对于离散数据色板,Semi Design 侧已声明了 20 个 Token,如果需要自定义离散数据色板,用户可以在 DSM 自定义主题时配置这些 Token。色值的具体生成步骤如下:
Step1: 遵从分裂互补取色,生成初版色稿
我们参考了经典配色理论,采用分裂互补取色原则,按照三个一组的方式进行取色。
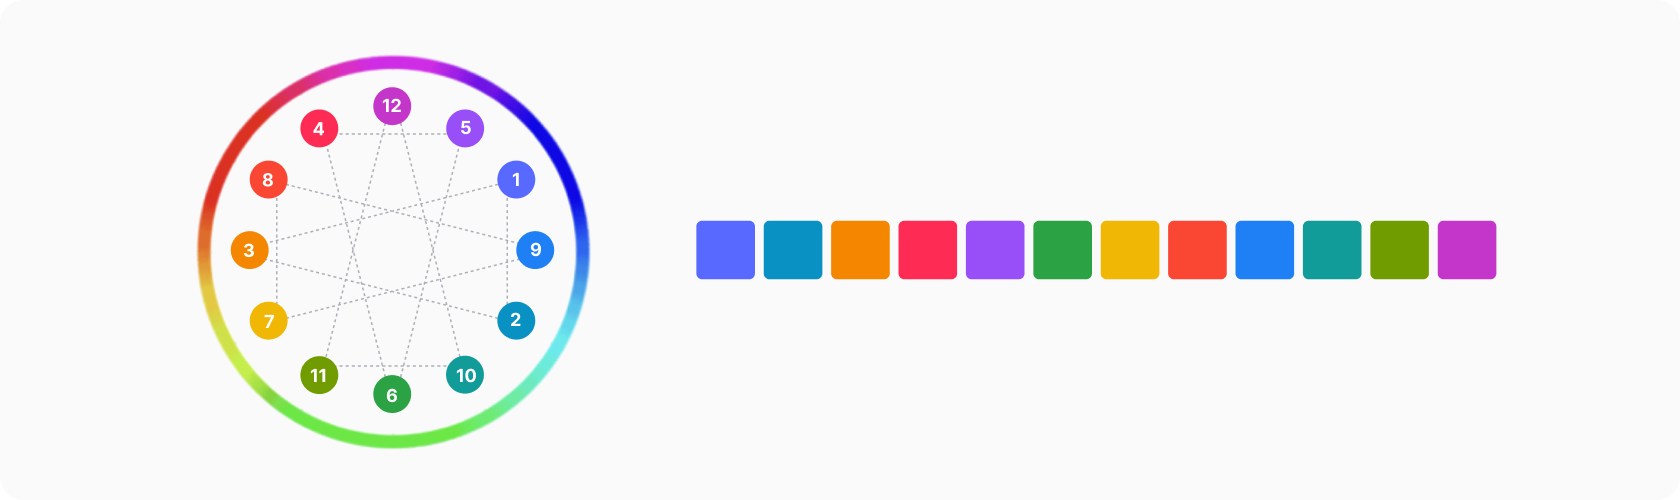
Step2: 基线矫正,降低歧义提升对比
- 规避红绿等易引起歧义的色彩。
- 为保证区分度, 增强色彩对比,相邻颜色按照“暗-亮-暗-亮”的节奏进行灰度调整。

Step3: 感性调整,提升视觉美学
为了让色彩体系更加和谐,在科学理论支撑之外,还需在真实业务场景下进行美学修正。

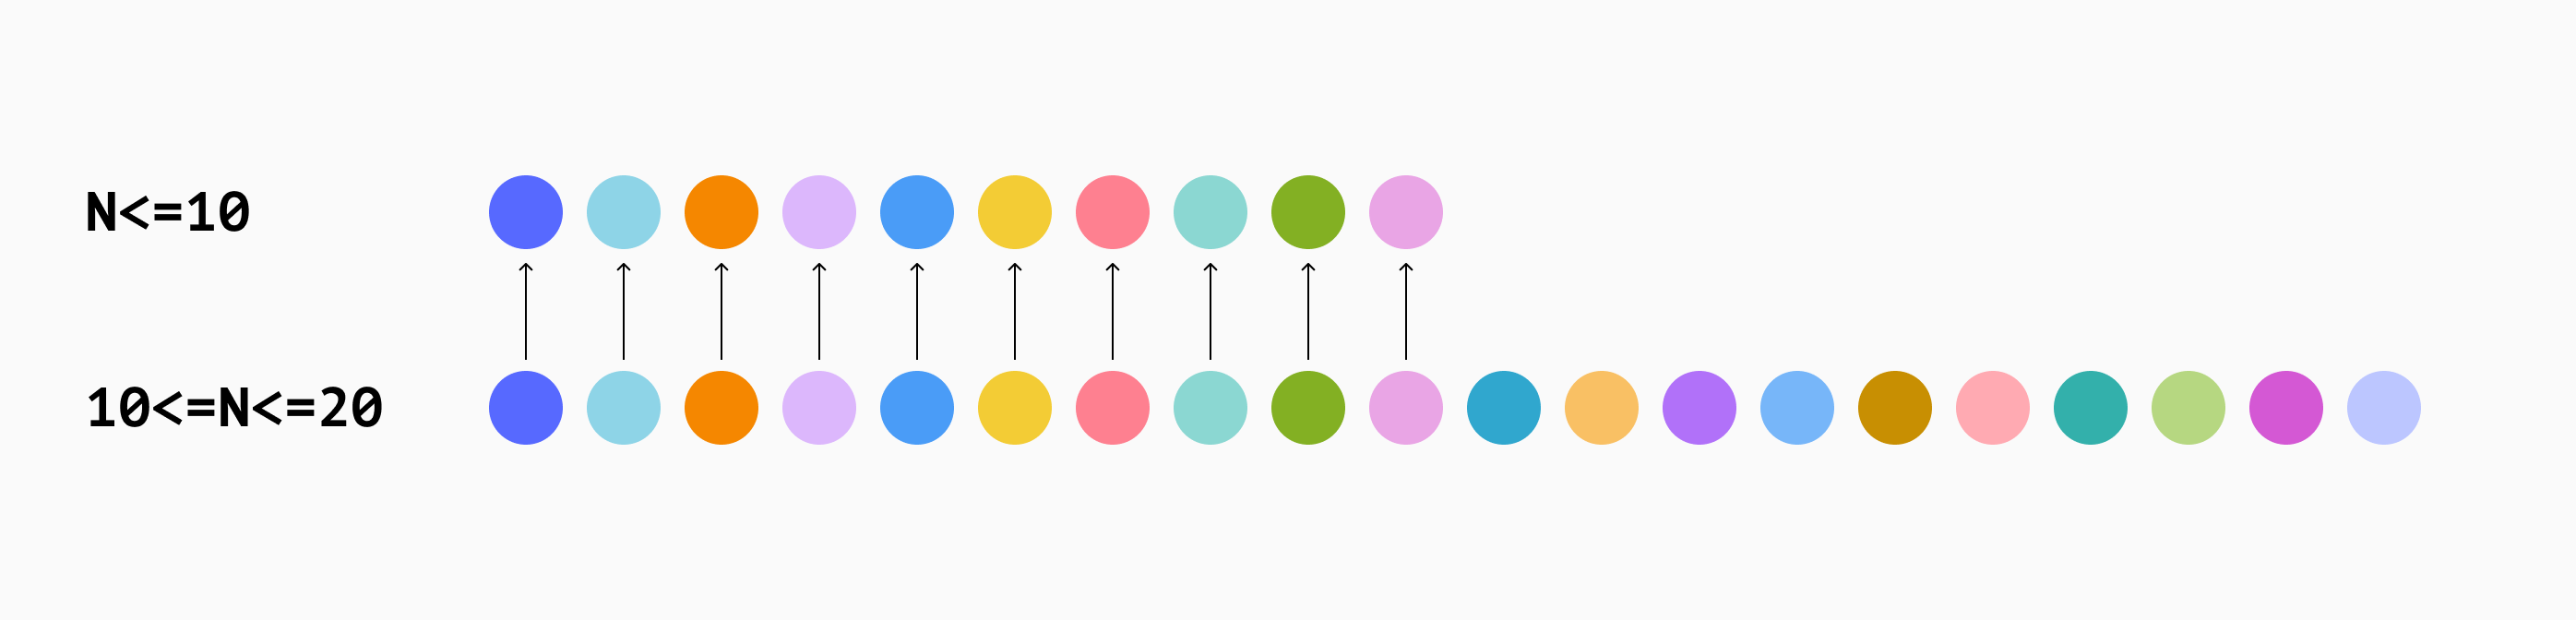
Step4: 色板延展,适应广泛场景
在 10 色色板的基础上,我们拓展到 20 色色板以适应更为广泛的业务场景。
在 VChart 中,还有许多应用于图表组件的语义颜色,比如背景色、边框、滑块、弹层、字体、字色等。@visactor/vchart-semi-theme 会读取 body 上的 Semi CSS Variables 的 Token 值来自动生成 VChart 图表主题,通常无需额外考虑此部分的规范。如果需要了解详细的语义颜色映射关系可以参阅以下两篇文档:
Design Token
Semi Design 为 VChart 声明的 20 个 Token 详见下表。
在 @visactor/vchart-semi-theme 1.10.2 版本前,其中的名称为 --semi-color-data-n(n 为 0, 2, 4, 6, 8, 10, 12, 14, 16, 18)的 Token 值作为 10 色的色板。
在 @visactor/vchart-semi-theme 1.10.2 版本后,其中的名称为 --semi-color-data-n(n 从 0 到 9)的 Token 作为 10 色的色板。
使用问题咨询/建议,可加入 VChart 用户群进行反馈 <ChartContact name1="微信号" name2="飞书用户群"